
Research
My research concerns the design and develop scalable visualization methods and integrate machine learning into visual interactive interfaces. My group's work enables human-in-the-loop data analysis of increasingly large and complex molecular data (imaging and spatial omics) acquired for biomedical research, most notably cancer therapy. We work closely with biomedical users to survey their goals and requirements, iteratively develop visualization prototypes, and conduct hands-on studies for qualitative and quantitative evaluation.
Visual analytics is an emerging research field to tackle big data analysis challenges. It creates added value by combining the processing power and accuracy of machines with human capabilities to perceive information visually. Interactive visualizations allow to explore and query the data and to configure and interpret integrated A.I. with domain knowledge. This increases trust in data, models, and results, which is especially important when critical decisions need to be made. The strengths of visual analytics have been shown to be particularly advantageous when problems and goals are underspecified and exploratory means are needed to discover yet unknown patterns.
Further research projects include the analysis of large-scale geographical (spatio-temporal) data, human-AI collaboration, and immersive analytics approaches. You can find more information and links to my research papers in the publication section.
Recent Research & Biomedical Visualization Projects
Scalable Image Data Rendering
We develop scalable 2D, 3D viewers for large and multiplex imaging data, as they appear in the biomedical domain. The data is often multiplex, which means the image contains multiple 2D or 3D (volumetric) channels, and sometimes an additional temporal dimension (multiplex video data). High-resolution image data can easily reach terrabytes in size, making it challenging to interactively load and render the data in the web. Our computationally scalable methods are capable to display the data at interactive rates and to zoom and pan in real time.
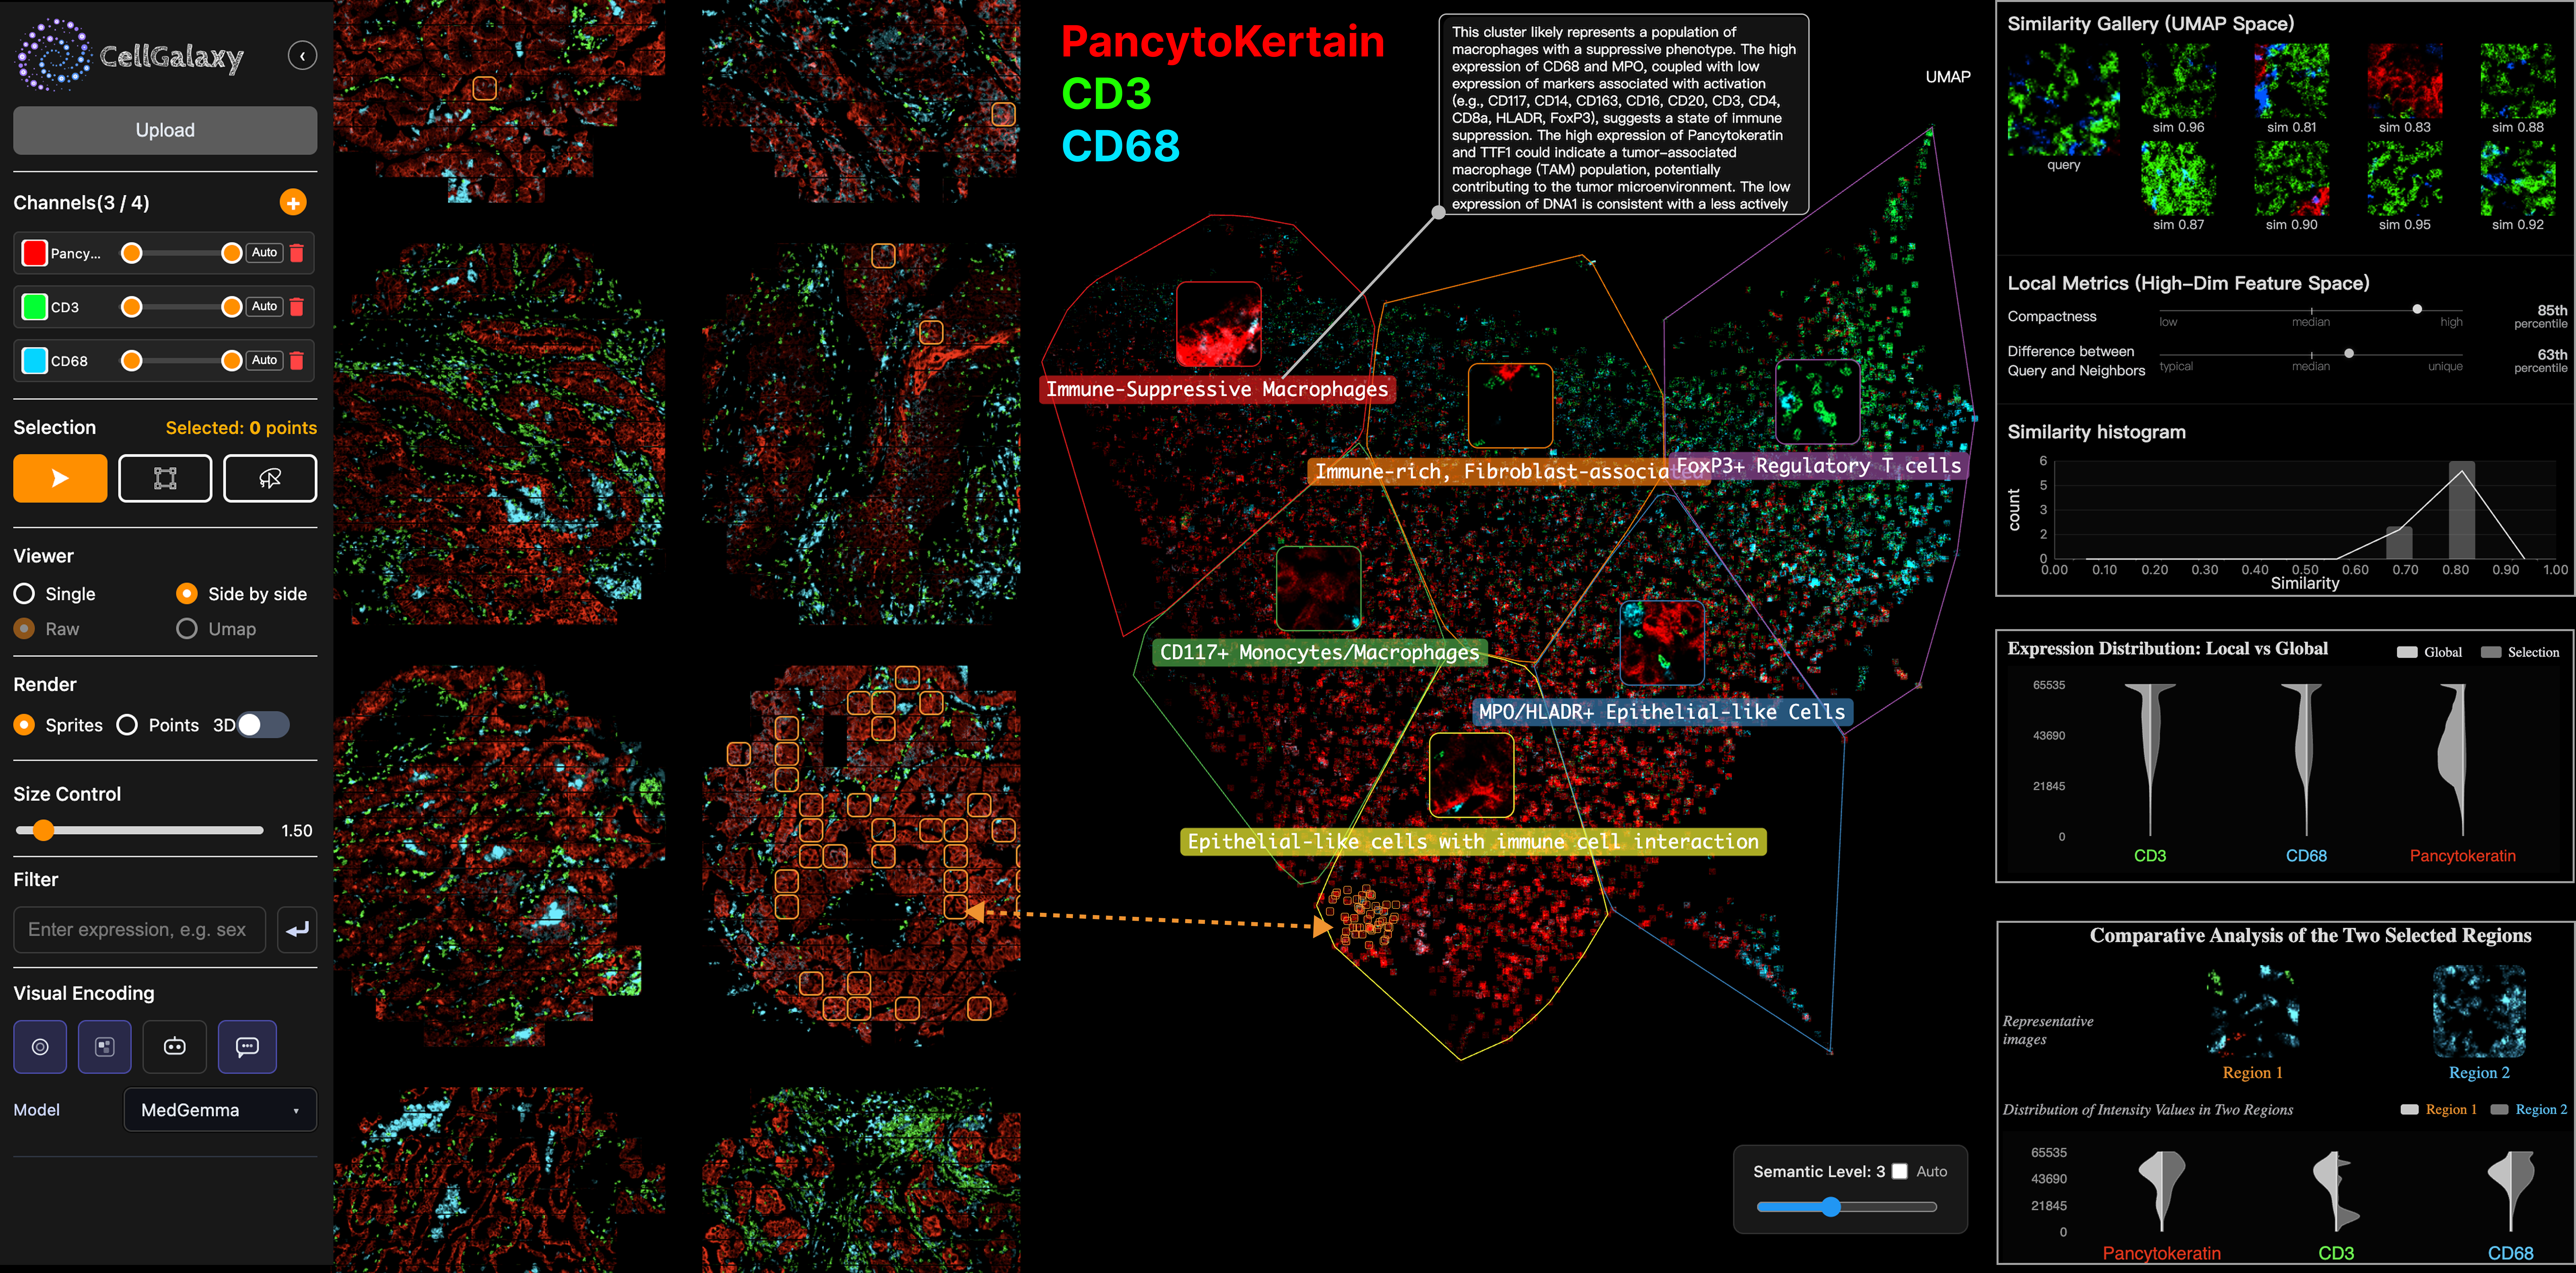
Visual Analytics for Tissue Imaging and Multi-Omics
On top of our interactive image viewers we support various tasks along the processing and analysis pipeline, ranging from proof-reading for segmentation and data cleaning to cell-typing and spatial analysis of cellular microenvironments. A focus lies on the tight integration of machine learning for human-AI collaboration. We evaluate the visual encoding, computational performance, and real-world usage of our research prototypes in close collaboration with biomedical experts.
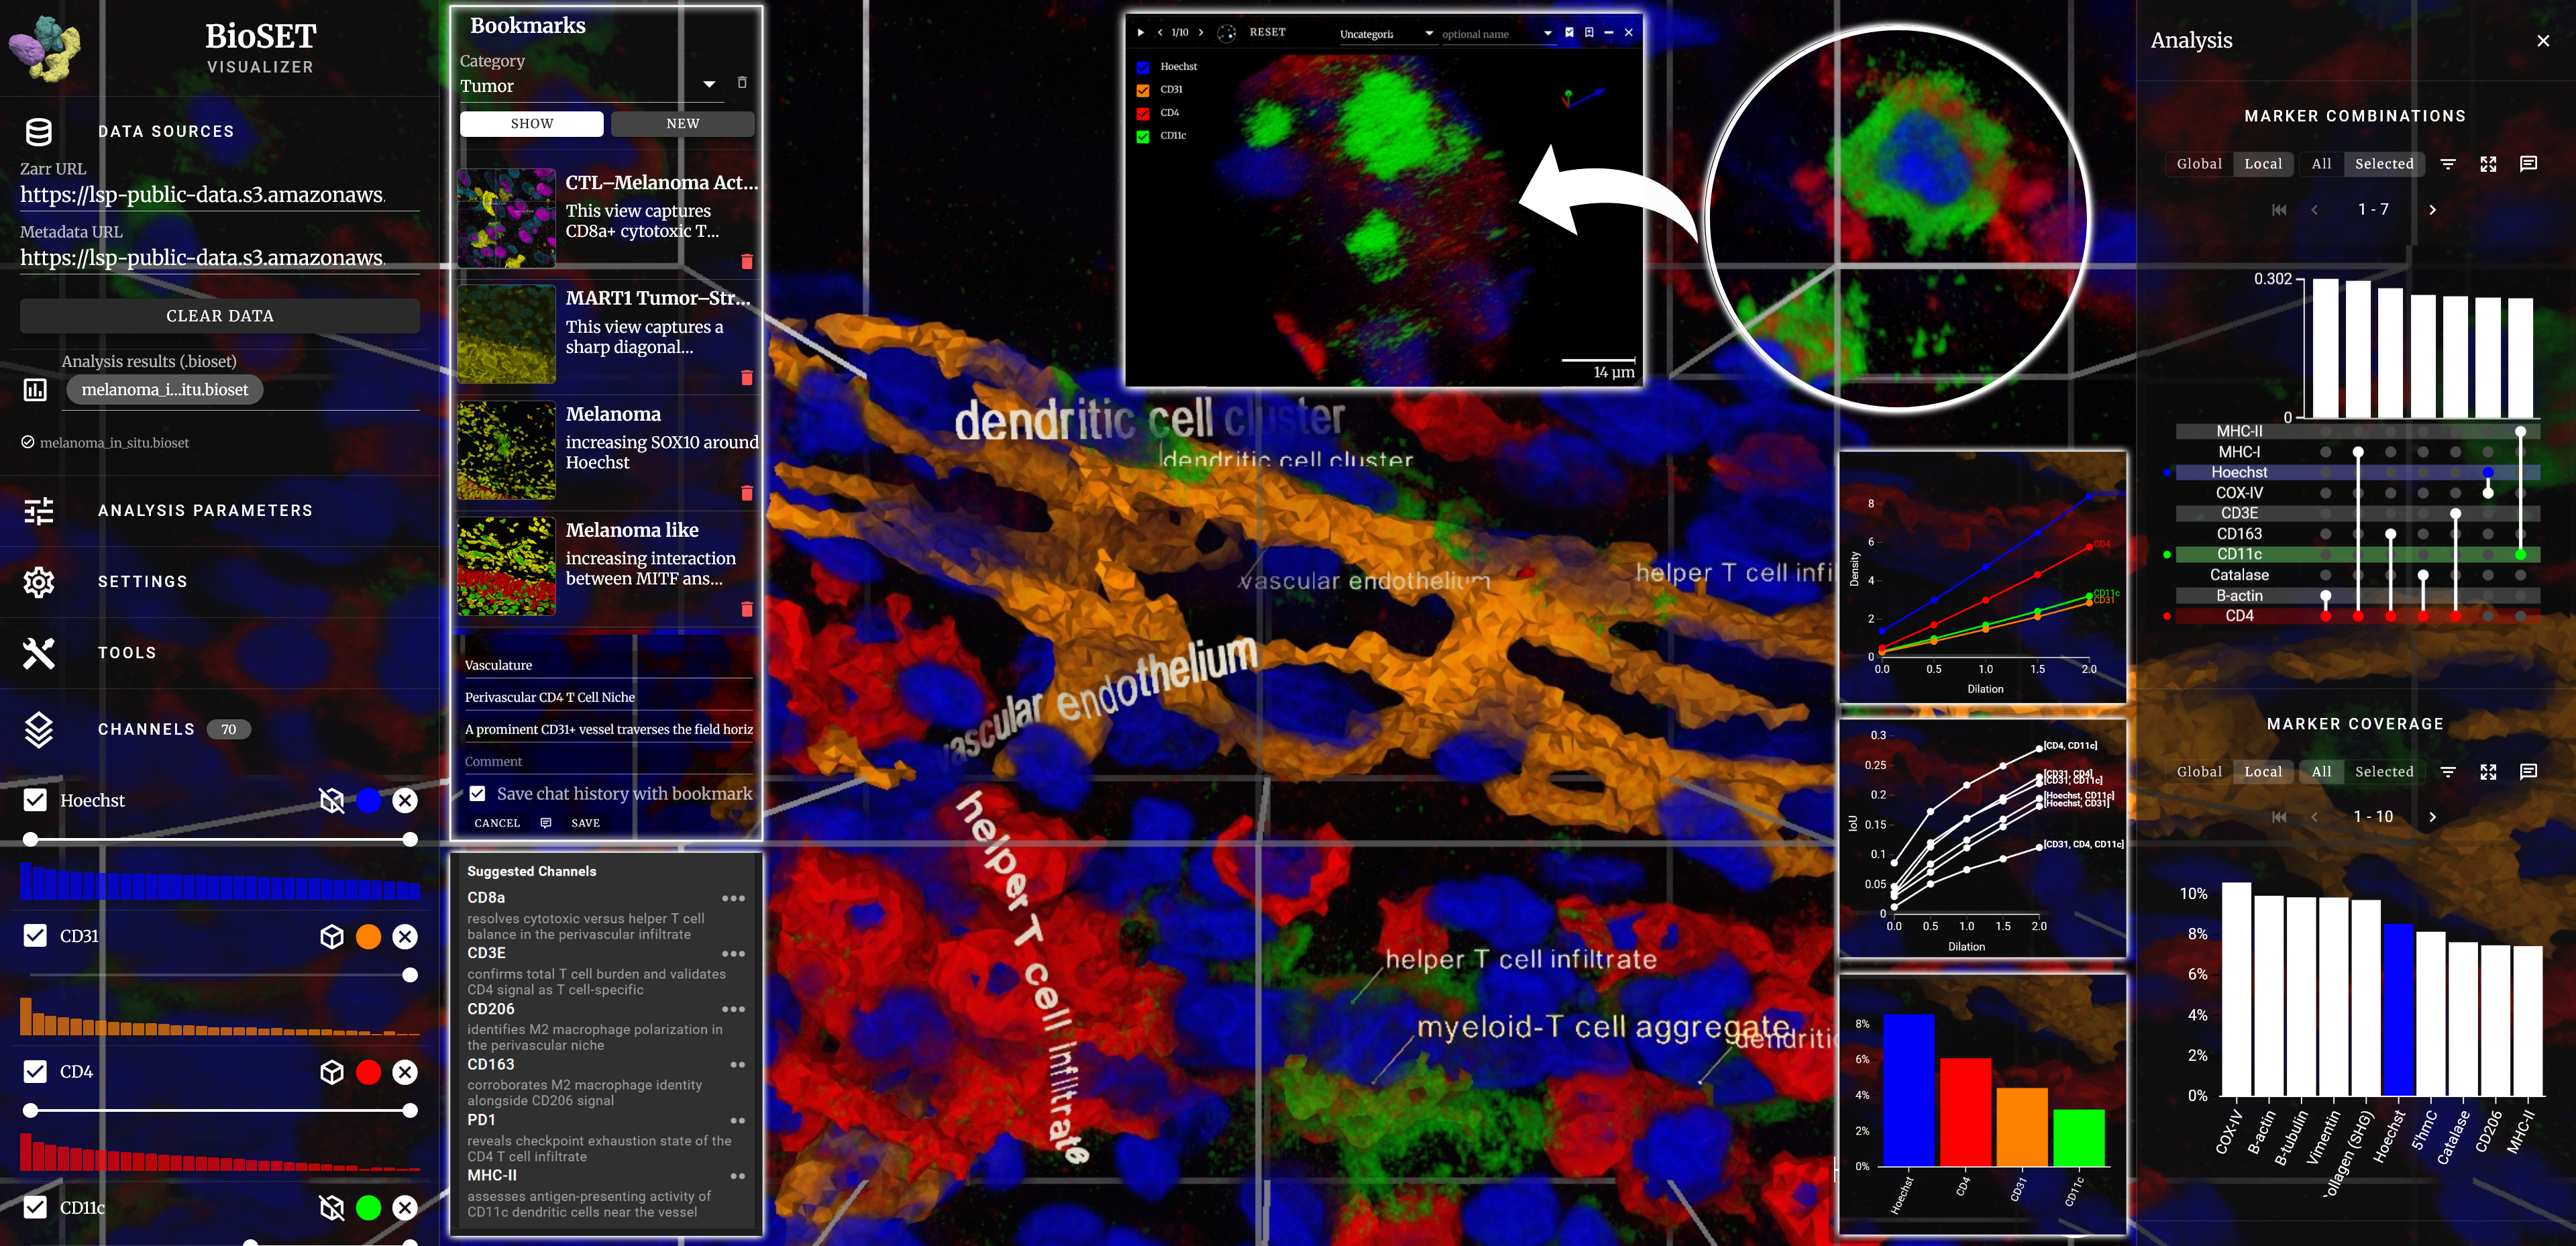
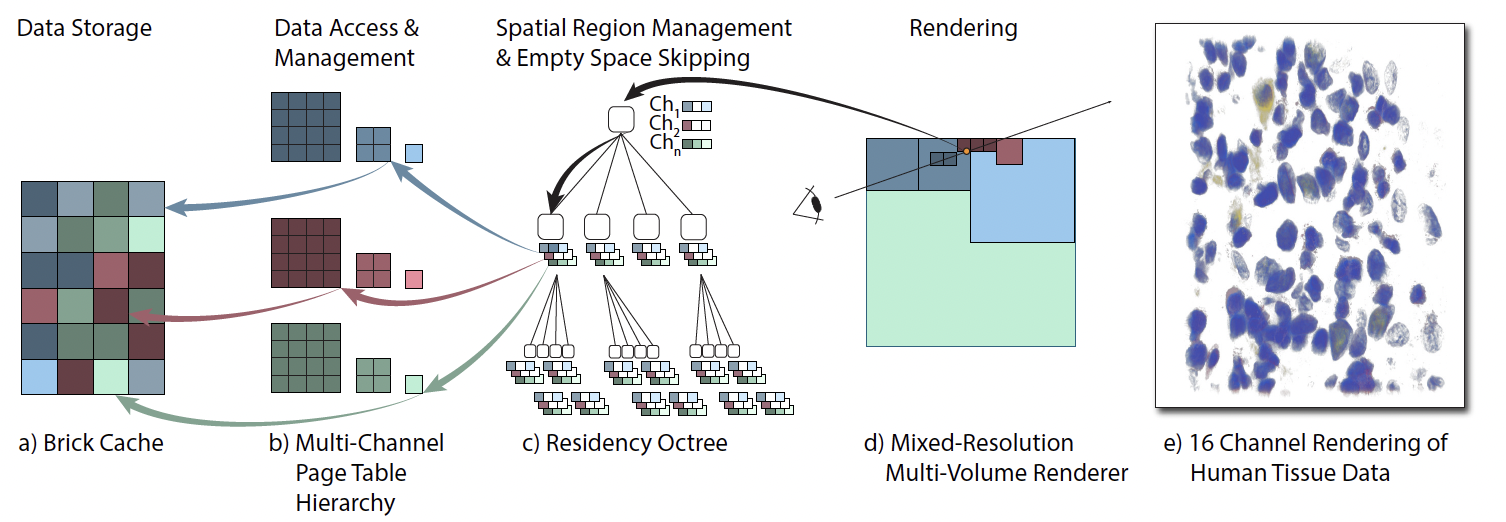
Spatial Analysis of Multi-Volume Data
Higher-resolution 3D imaging can reveal deeper insights into cellular tissue microenvironments. We develop scalable multi-volume rendering methods and accompanied spatial analysis tools, ranging from detecting marker co-localization to ml-based feature extraction and analysis.
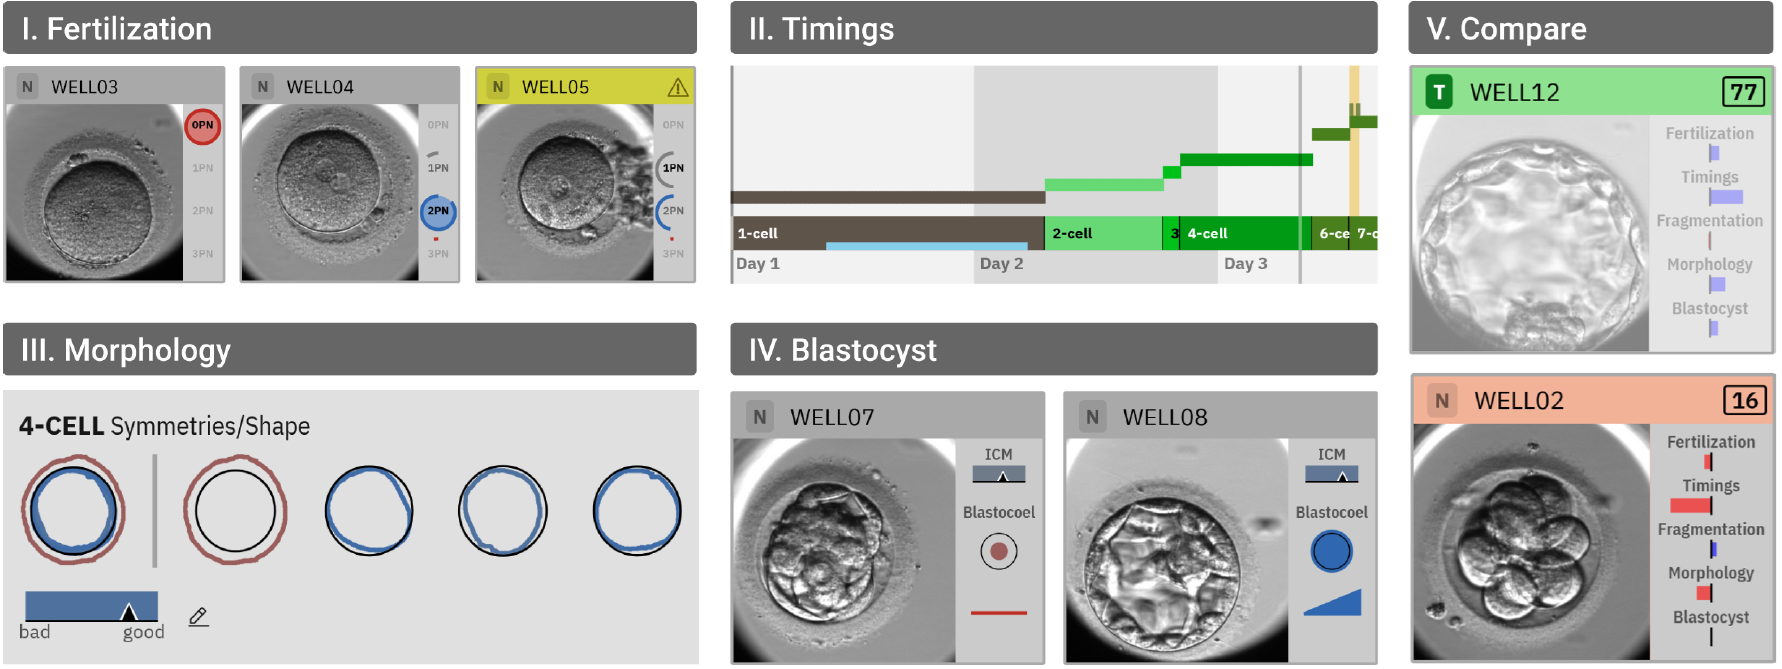
Analytics of Live-Cell Imaging Data
We design visual interfaces to analyze multiplex live-cell imaging data. Current projects range from in-vitro fertilization to CAR-T cell experiments for cancer treatment. We currently tackle the streaming and interactive display of such data in the web and the integration of human-in-the-loop AI to trace, examine and grade cellular/tissue development. We therefore integrate explainable AI methods to help experts in their decision making and interpretation.
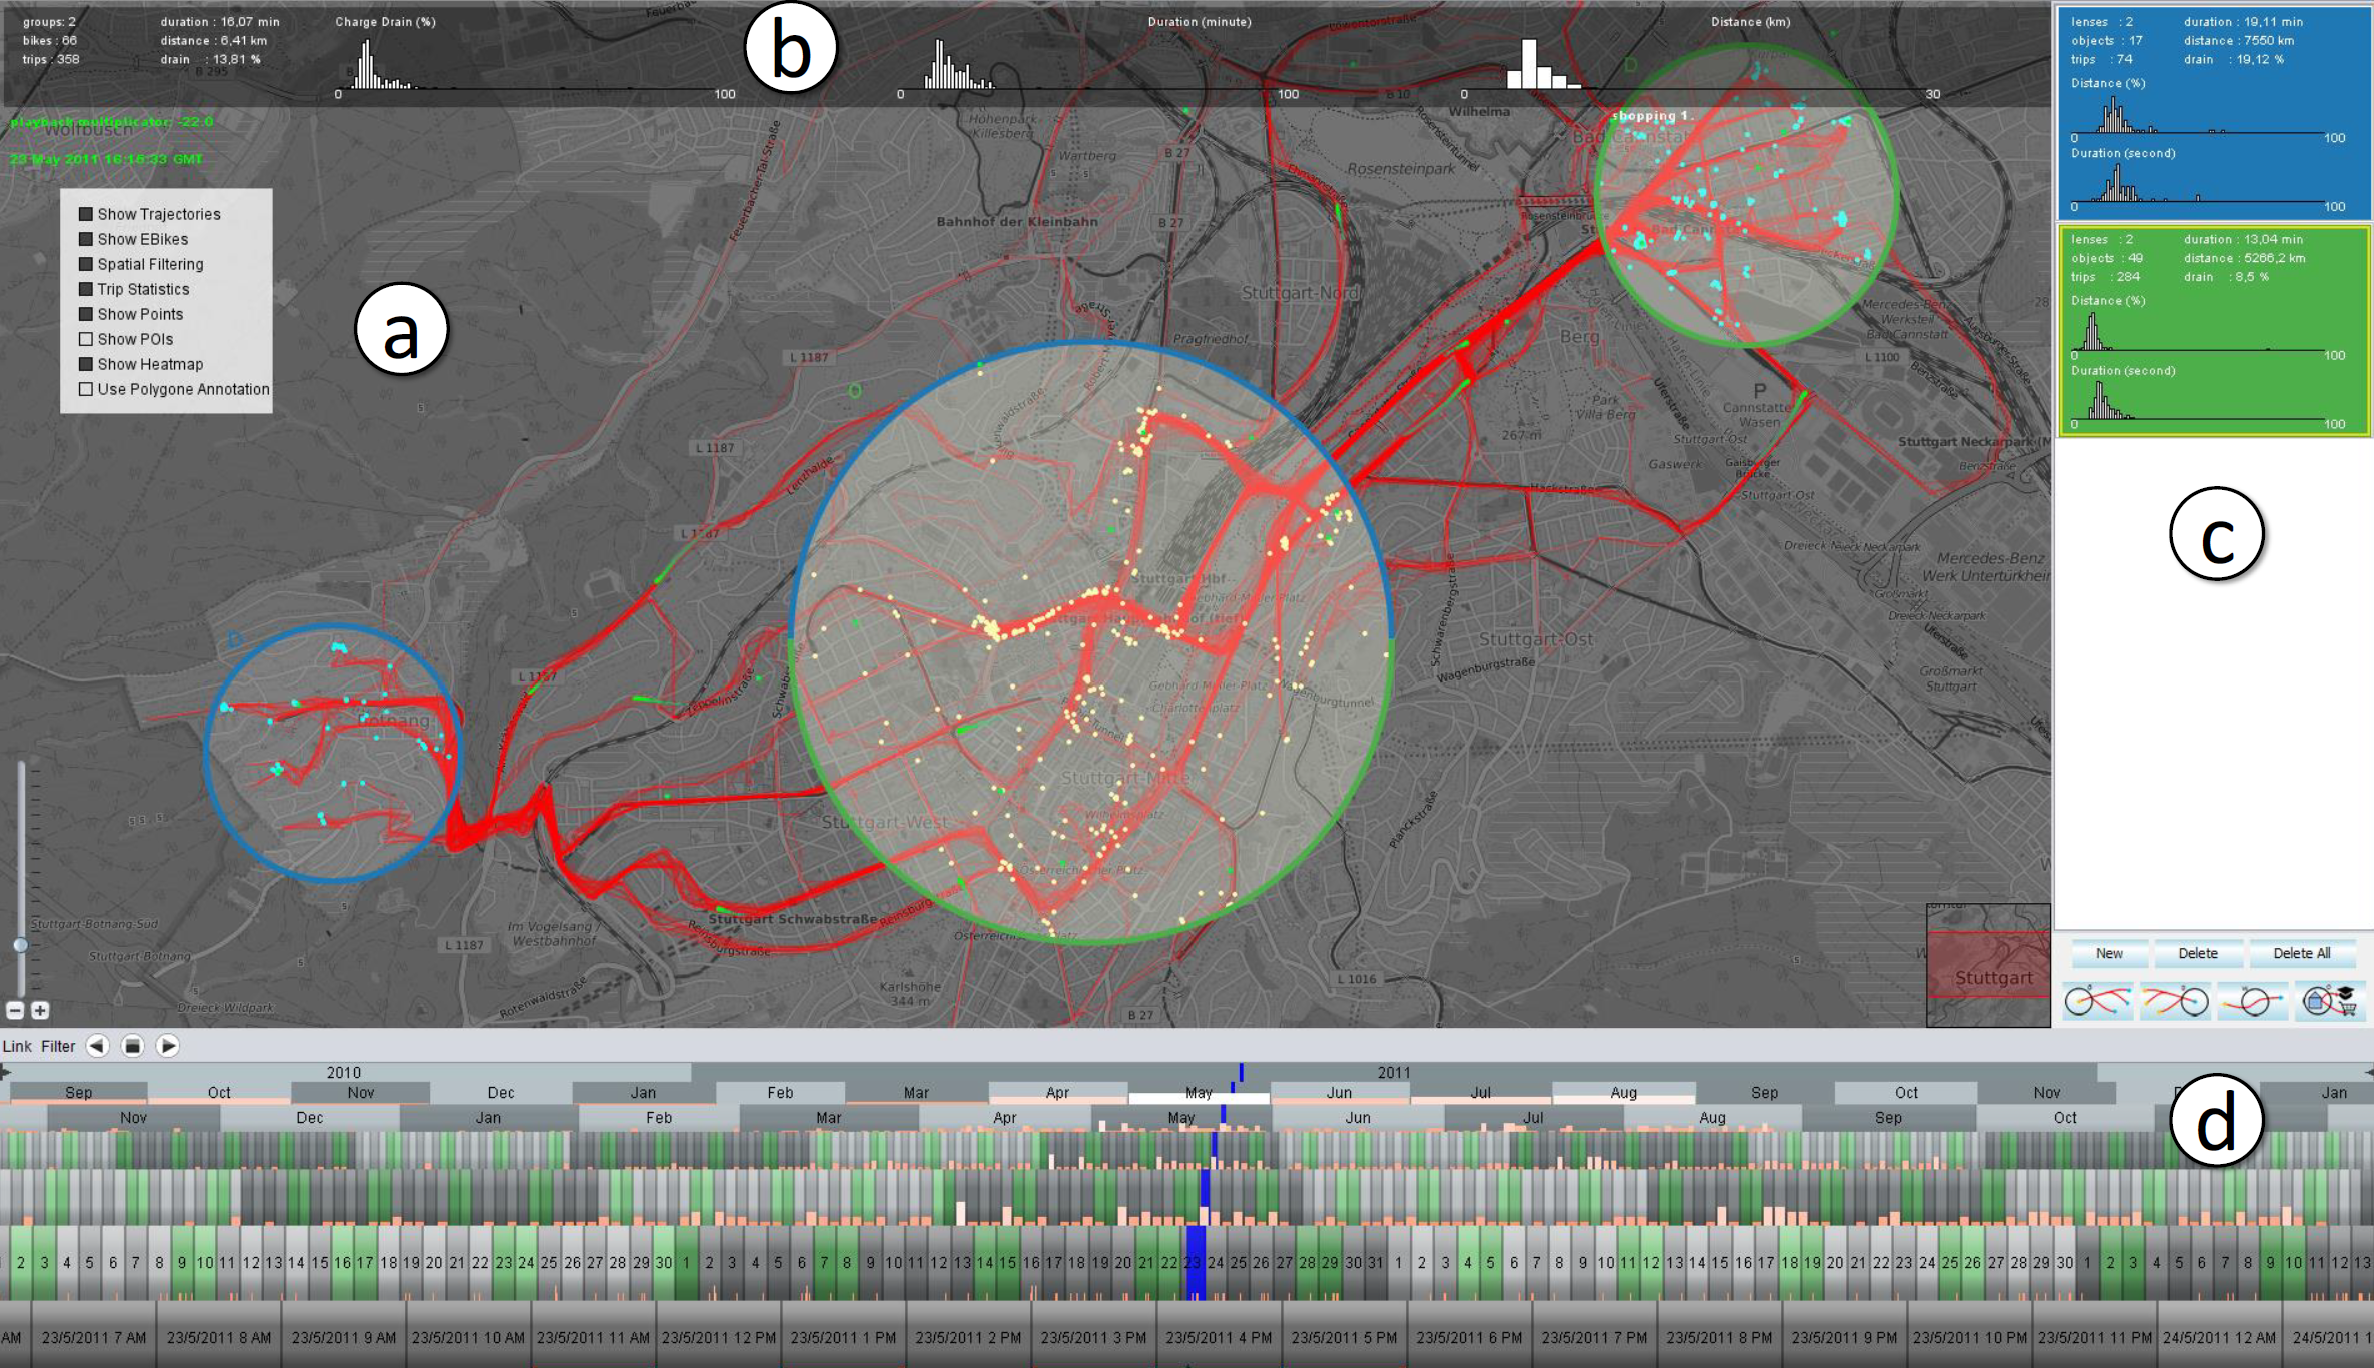
Geographic and Mobility Data Visualization
Beyond the biomedical domain, spatial datasets occur in geographic application domains. We work on geographic information science and systems. A specific expertise of the lab is the visual analysis of movement and mobility data, ranging from map matching to semantic enrichment, querying, filtering and interpretation.